With several years assembled, panel990 classifies each
organization by how its observations sit in the panel window,
so you can slice out entrants, exits, or a balanced set.
In a real project you would start from a download – for example
panelize(tables = c("P00", "P01"), years = 2016:2022, bmf = TRUE)
– but the classification works on any data frame with an id and a year,
so this tutorial uses a small in-memory panel.
panel <- data.frame(
  EIN2     = c(rep("A", 5), rep("B", 3), rep("C", 3), rep("D", 2)),
  TAX_YEAR = c(2018:2022,   2020:2022,   2018:2020,   c(2018, 2022)),
  revenue  = c(10:14,       20:22,       30:32,       c(40, 44)),
  stringsAsFactors = FALSE
)
Describe the panel
Classification has two independent axes:
-
panel_type(boundary):persistent(present at the first and last year),entrant(enters late, present at the end),exit(present at the start, gone before the end),transient(only interior years),empty. -
panel_spell(continuity):seamless(consecutive years) orsegmented(interior gaps).
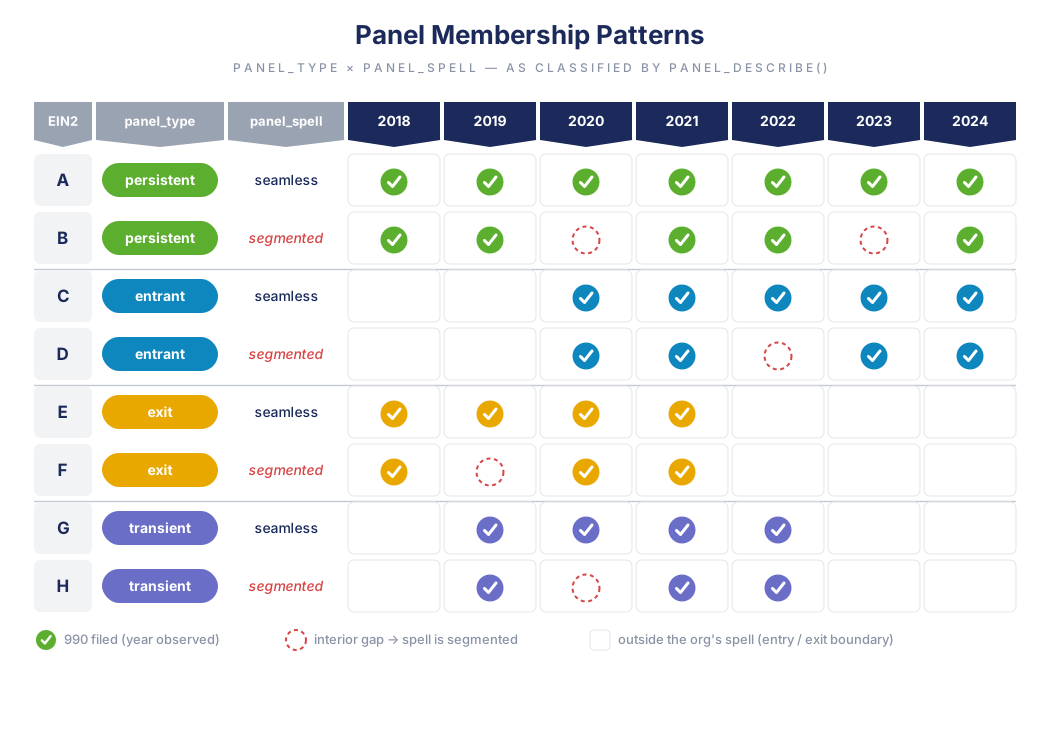
panel_describe(panel, time = "TAX_YEAR", id = "EIN2")
#> <panel_summary>  4 orgs x 5 years (2018-2022)
#>
#> panel types (org counts by spell):
#>  panel_type seamless segmented total pct
#>  persistent        1         1     2  50
#>     entrant        1         0     1  25
#>        exit        1         0     1  25
#>
#> org-years by type:
#>  year persistent entrant exit
#>  2018          2       0    1
#>  2019          1       0    1
#>  2020          1       1    1
#>  2021          1       1    0
#>  2022          2       1    0
Organization A spans 2018–2022 with no gaps (persistent
+ seamless – the “balanced” case); D also spans the window
but skips the middle years (persistent +
segmented); B enters in 2020 (entrant); C
leaves after 2020 (exit).
Slice by membership
panel_filter() returns the rows of the organizations
that match. It classifies internally, so you just name what you
want:
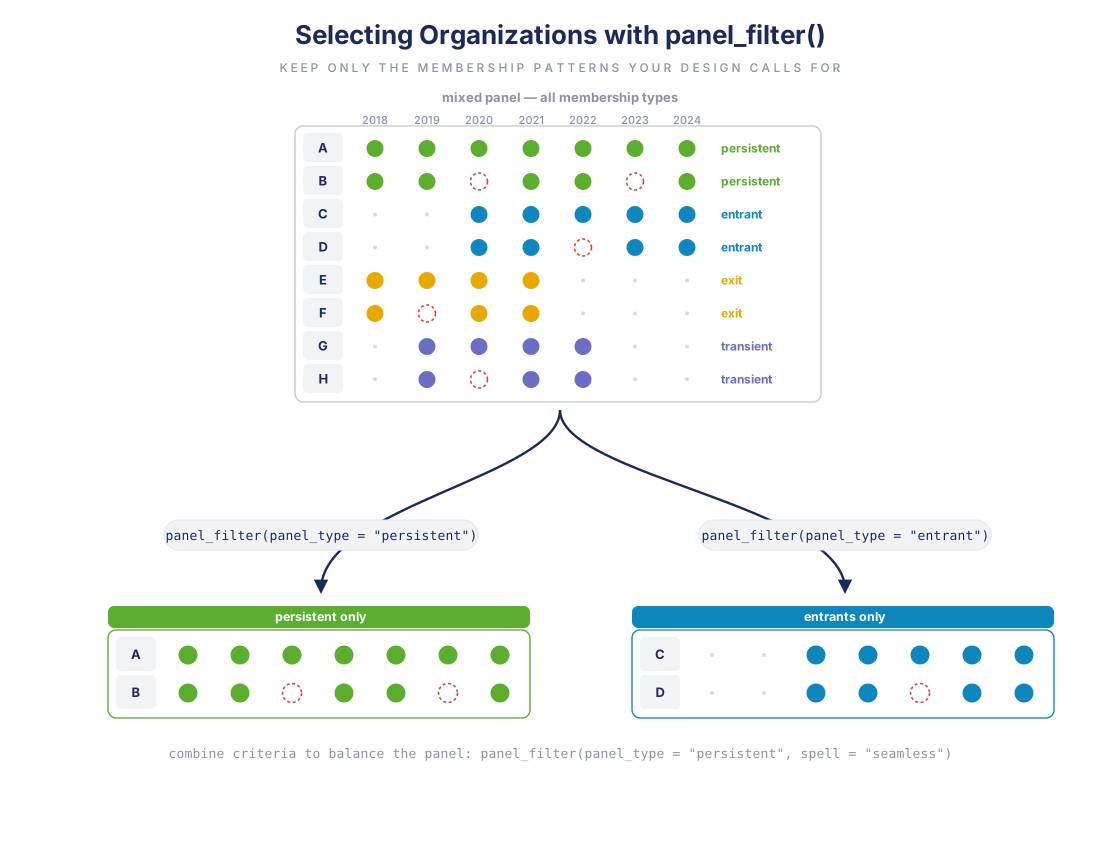
# new entrants
unique(panel_filter(panel, panel_type = "entrant",
                    time = "TAX_YEAR", id = "EIN2")$EIN2)
#> [1] "B"

# exits
unique(panel_filter(panel, panel_type = "exit",
                    time = "TAX_YEAR", id = "EIN2")$EIN2)
#> [1] "C"

# a balanced panel = spans the window with no gaps
unique(panel_filter(panel, panel_type = "persistent", spell = "seamless",
                    time = "TAX_YEAR", id = "EIN2")$EIN2)
#> [1] "A"
min_obs= adds a minimum number of observed years, and
passing a pre-computed classification (from
panel_describe()) avoids reclassifying.
Attach labels for your own analysis
panel_label() appends the classification columns to
every row, preserving order – handy for grouping or modelling:
labelled <- panel_label(panel, time = "TAX_YEAR", id = "EIN2")
labelled[!duplicated(labelled$EIN2),
         c("EIN2", "panel_type", "panel_spell", "panel_year_count")]
#>    EIN2 panel_type panel_spell panel_year_count
#> 1     A persistent    seamless                5
#> 6     B    entrant    seamless                3
#> 9     C       exit    seamless                3
#> 12    D persistent   segmented                2
Slicing through a sample frame
Inside a sample frame, classify_panel() stores the two
axes as label rules, so panel membership becomes just another filter you
can compose with the others:
sfw <- classify_panel(create_sfw("panel demo"), panel)
get_rules(sfw)
#>          name  type active                 detail
#> 1  panel_type label   TRUE  -> panel_type (4 ids)
#> 2 panel_spell label   TRUE -> panel_spell (4 ids)

# keep only the window-spanning organizations
persistent <- apply_sfw(panel, sfw, panel_type = "persistent", verbose = FALSE)
unique(persistent$EIN2)
#> [1] "A" "D"
Combined with the filters and BMF traits from the previous tutorial, this lets a single frame express a full study sample – “Georgia 501(c)(3) housing nonprofits observed as a balanced panel from 2019 to 2021” – and apply it consistently across every step of the analysis.