panel990 assembles IRS 990 efile tables into
research-ready panels and gives you a small vocabulary of verbs for
describing, selecting, and cleaning them. This tour walks the whole
pipeline in six steps:
- Build the panel from the raw efile tables
- Identify each organization’s membership pattern
- Filter to the patterns your design calls for (including a balanced panel)
- Impute missing interior years
- Smooth noisy series
- Reconcile the accounting identities that cleaning disturbs
Each step below pairs a short code example with a picture of what the verb does. The download step needs network access, so it is shown but not run; every other example runs on a small in-memory panel.
1. Build the panel
panelize() is the one-shot assembler: it downloads the
tables you name for the years you name, merges them within each year,
stacks the years, and (optionally) attaches organization traits from the
Business Master File:
panel <- panelize(
  tables = c("P00", "P01", "P08", "P09", "P10"),   # header, summary, revenue,
  years  = 2019:2022,                              #   expenses, balance sheet
  bmf    = TRUE
)
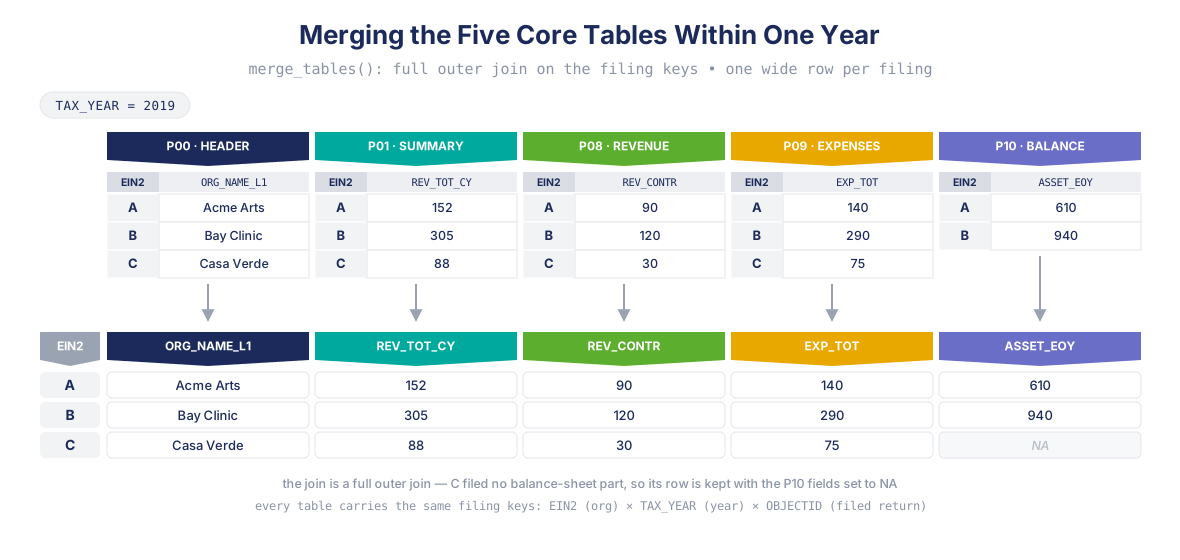
Within each year the five tables are joined into one wide row per
filing. Every table carries the same filing keys (EIN2 ×
TAX_YEAR × OBJECTID), and the join is a full
outer join, so a filing missing from one part keeps its row:
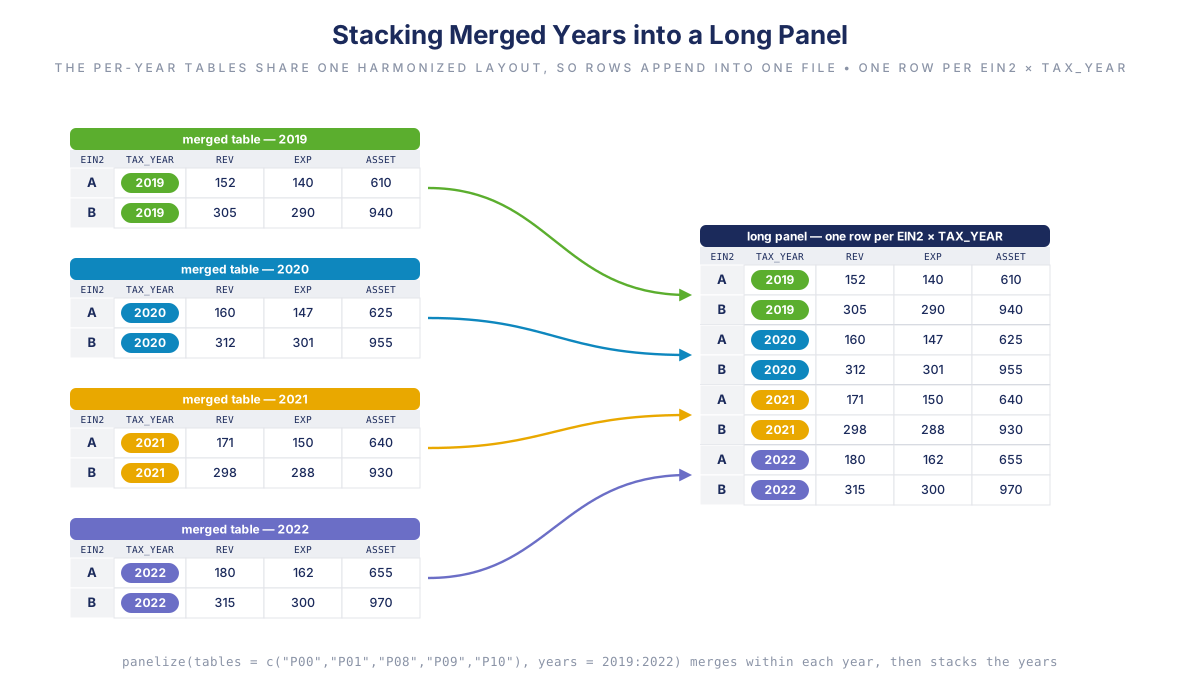
The per-year tables share a harmonized layout, so they stack into one long panel with one row per organization-year:
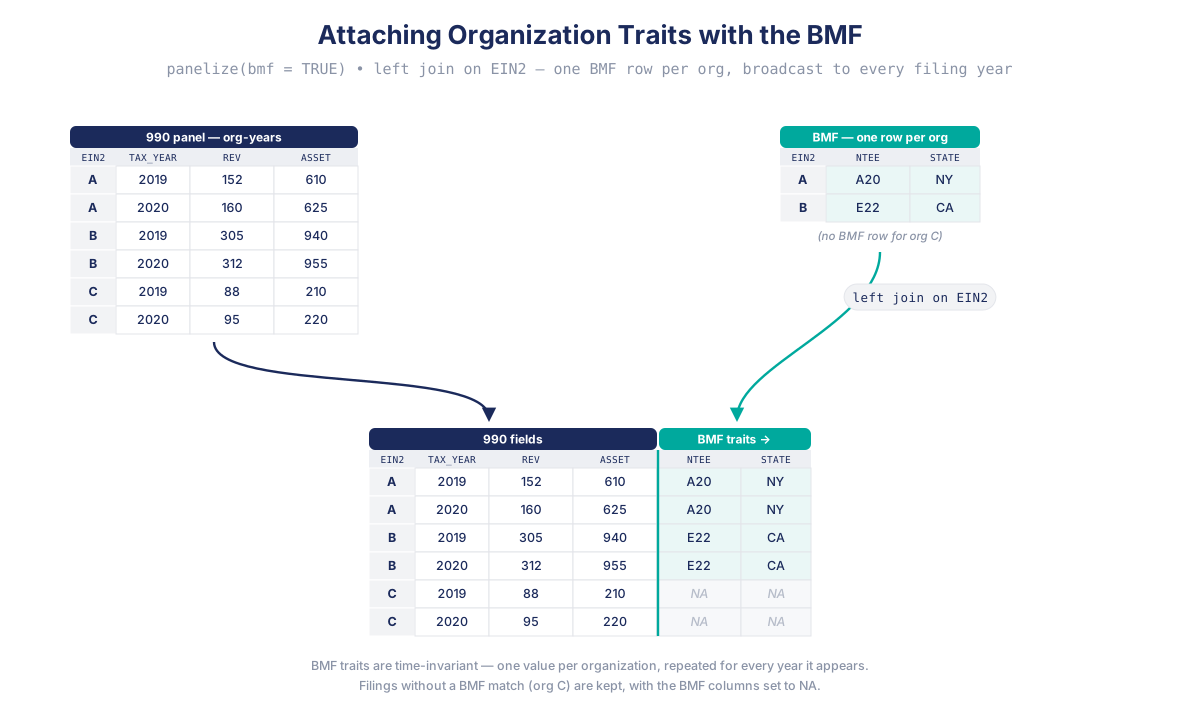
bmf = TRUE then left-joins the BMF on EIN2,
appending time-invariant organization traits (name, NTEE, subsection,
geography) to the right of the 990 fields and broadcasting them to every
year the organization appears:
Everything after this point works the same on a panel
object or on any plain data frame with an id and a year column, so the
rest of the tour uses a small in-memory panel:
2. Identify panel types
Organizations rarely appear in every year of a panel.
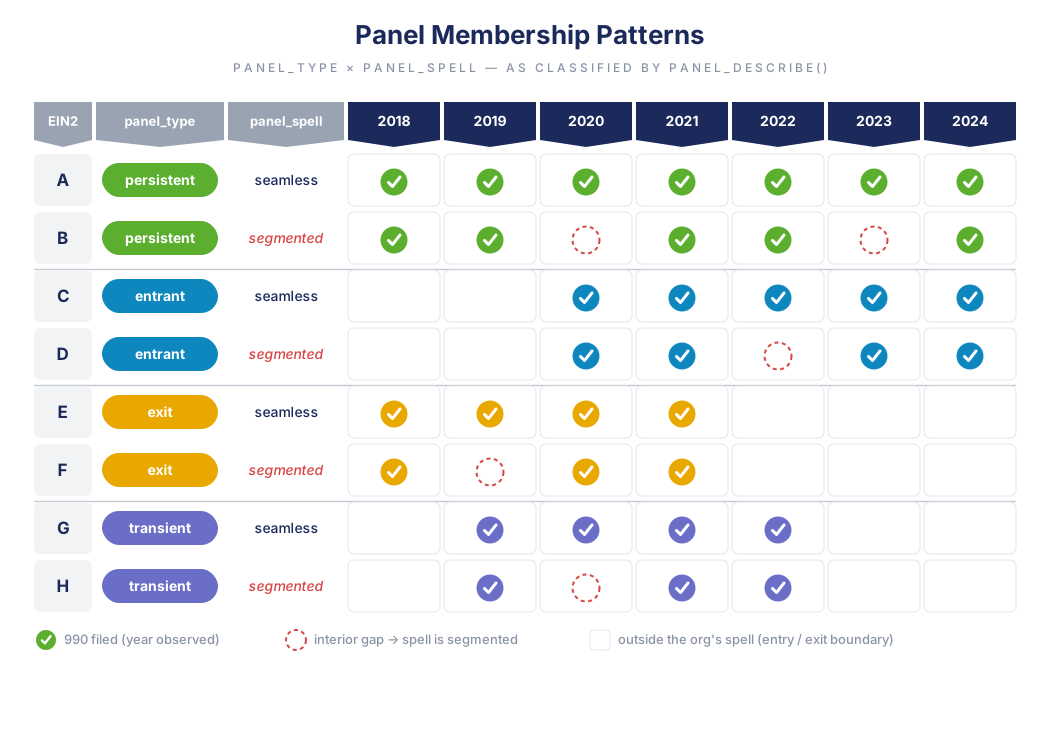
panel_describe() classifies each one on two independent
axes:
-
panel_type(boundary) — which edges of the window the org touches:persistent,entrant,exit,transient. -
panel_spell(continuity) — whether its observed years are consecutive (seamless) or contain interior gaps (segmented).
panel_describe(panel, time = "TAX_YEAR", id = "EIN2")
#> <panel_summary>  4 orgs x 5 years (2018-2022)
#>
#> panel types (org counts by spell):
#>  panel_type seamless segmented total pct
#>  persistent        1         1     2  50
#>     entrant        1         0     1  25
#>        exit        1         0     1  25
#>
#> org-years by type:
#>  year persistent entrant exit
#>  2018          2       0    1
#>  2019          1       0    1
#>  2020          1       1    1
#>  2021          1       1    0
#>  2022          2       1    0
A spans the window with no gaps (persistent
+ seamless — the balanced case), B enters
late, C exits early, and D spans the window
but skips the middle (persistent +
segmented).
3. Filter panel types
panel_filter() keeps the rows of the organizations whose
classification matches. It classifies internally, so you just name what
you want:
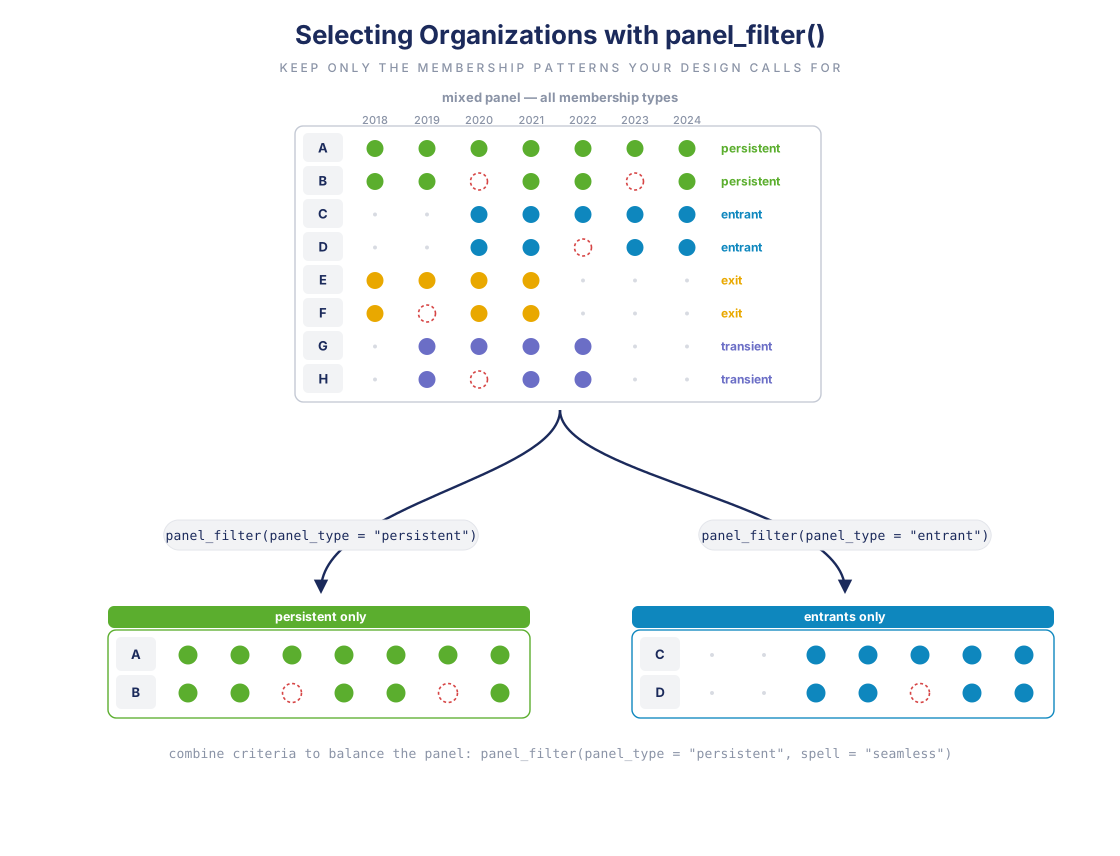
# organizations that span the whole window
unique(panel_filter(panel, panel_type = "persistent",
                    time = "TAX_YEAR", id = "EIN2")$EIN2)
#> [1] "A" "D"

# new entrants
unique(panel_filter(panel, panel_type = "entrant",
                    time = "TAX_YEAR", id = "EIN2")$EIN2)
#> [1] "B"
Searching for a balanced panel
A balanced panel is a rectangle: every retained
organization observed in every retained year. You can select it by
pattern —
panel_filter(panel_type = "persistent", spell = "seamless")
— or let panel_balance() search for the year
window that maximizes retained observations:
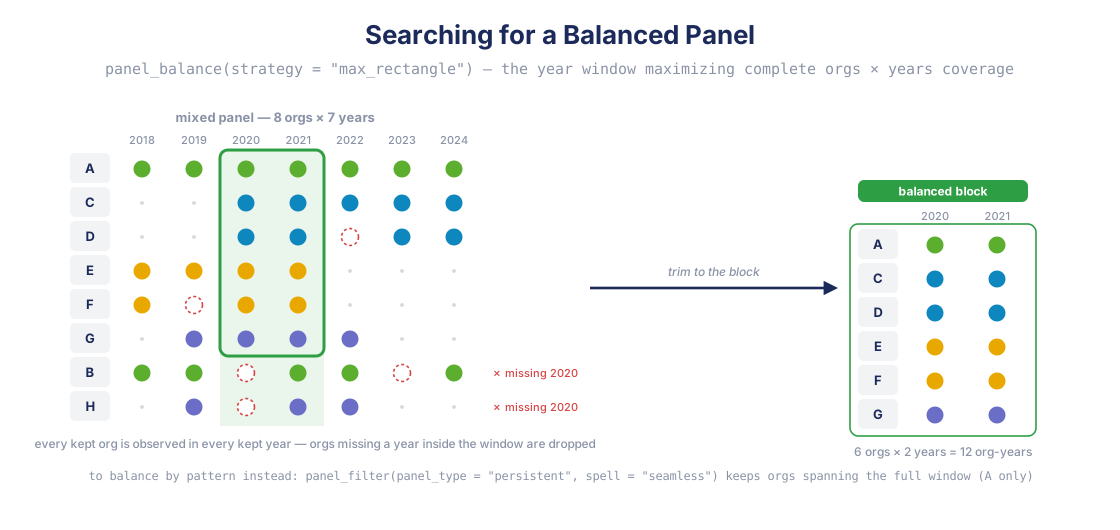
best <- panel_balance(panel, strategy = "max_rectangle",
                      id = "EIN2", time = "TAX_YEAR")
attr(best, "balance")
#> $years
#> [1] 2018 2019 2020
#>
#> $n_years
#> [1] 3
#>
#> $orgs_kept
#> [1] 2
#>
#> $orgs_dropped
#> [1] 2
4. Impute missing cases
panel_impute() inserts an organization’s missing
interior years and fills their numeric fields from the observations
bracketing each gap (method = "interpolate",
"mean", "locf", or "nocb").
Inserted rows are flagged imputed_row = TRUE so they are
never mistaken for filings:
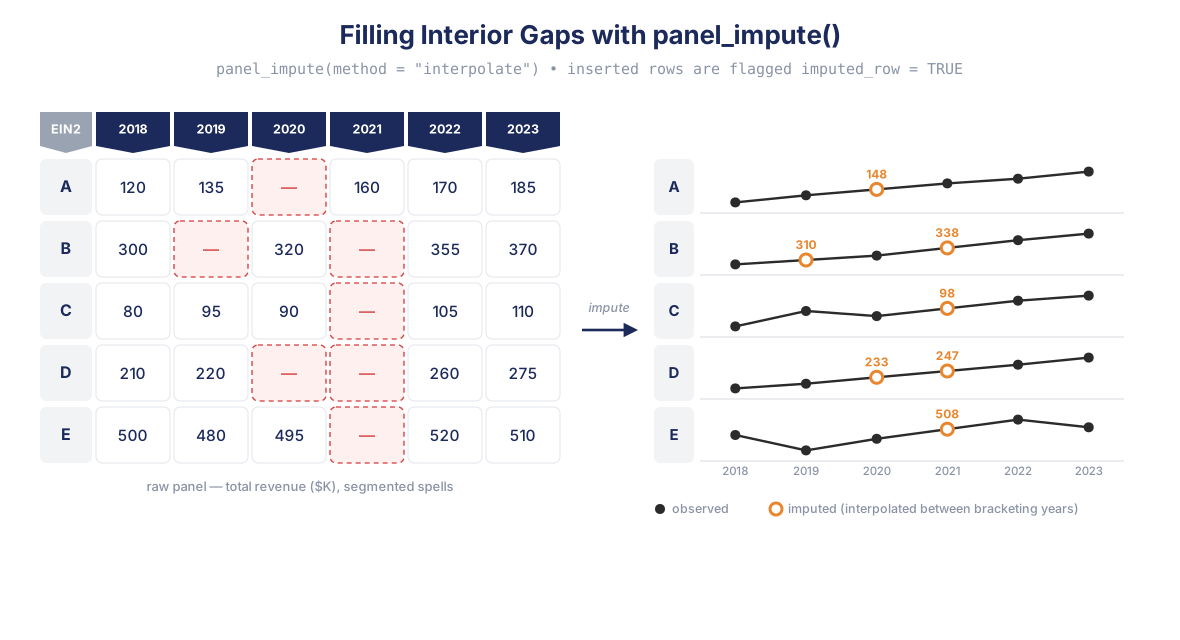
filled <- panel_impute(panel, vars = "revenue", method = "interpolate")
filled[filled$EIN2 == "D", c("EIN2", "TAX_YEAR", "revenue", "imputed_row")]
#>    EIN2 TAX_YEAR revenue imputed_row
#> 12    D     2018      40       FALSE
#> 13    D     2019      41        TRUE
#> 14    D     2020      42        TRUE
#> 15    D     2021      43        TRUE
#> 16 D 2022 44 FALSED’s 2019–2021 hole is interpolated between its 2018 and
2022 filings. (The researcher-facing wrapper
panel_complete() fills every segmented span in one
call.)
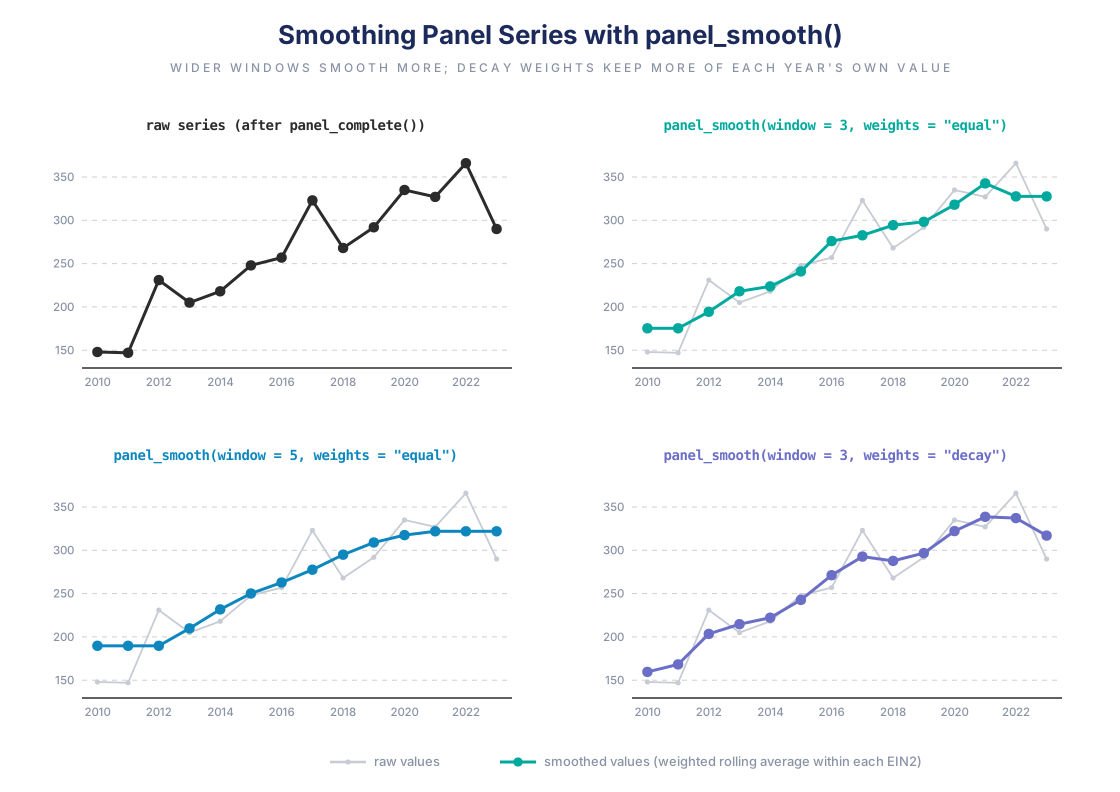
5. Smooth values
panel_smooth() replaces a numeric field with a rolling
weighted average taken within each organization. window
sets how many years are averaged; weights sets how much the
focal year keeps ("equal", "half", or
"decay"):
noisy <- data.frame(
  EIN2     = "A",
  TAX_YEAR = 2016:2022,
  revenue  = c(10, 12, 11, 50, 13, 12, 11)   # one-year spike
)
sm <- function(w, wt) round(panel_smooth(noisy, "revenue", window = w,
                                         weights = wt, verbose = FALSE)$revenue, 1)
data.frame(year = noisy$TAX_YEAR, raw = noisy$revenue,
           w3_equal = sm(3, "equal"), w5_equal = sm(5, "equal"),
           w3_decay = sm(3, "decay"))
#>   year raw w3_equal w5_equal w3_decay
#> 1 2016  10     11.0     19.2     10.7
#> 2 2017  12     11.0     19.2     11.2
#> 3 2018  11     24.3     19.2     21.0
#> 4 2019  50     24.7     19.6     31.0
#> 5 2020  13     25.0     19.4     22.0
#> 6 2021  12     12.0     19.4     12.0
#> 7 2022  11     12.0     19.4     11.6
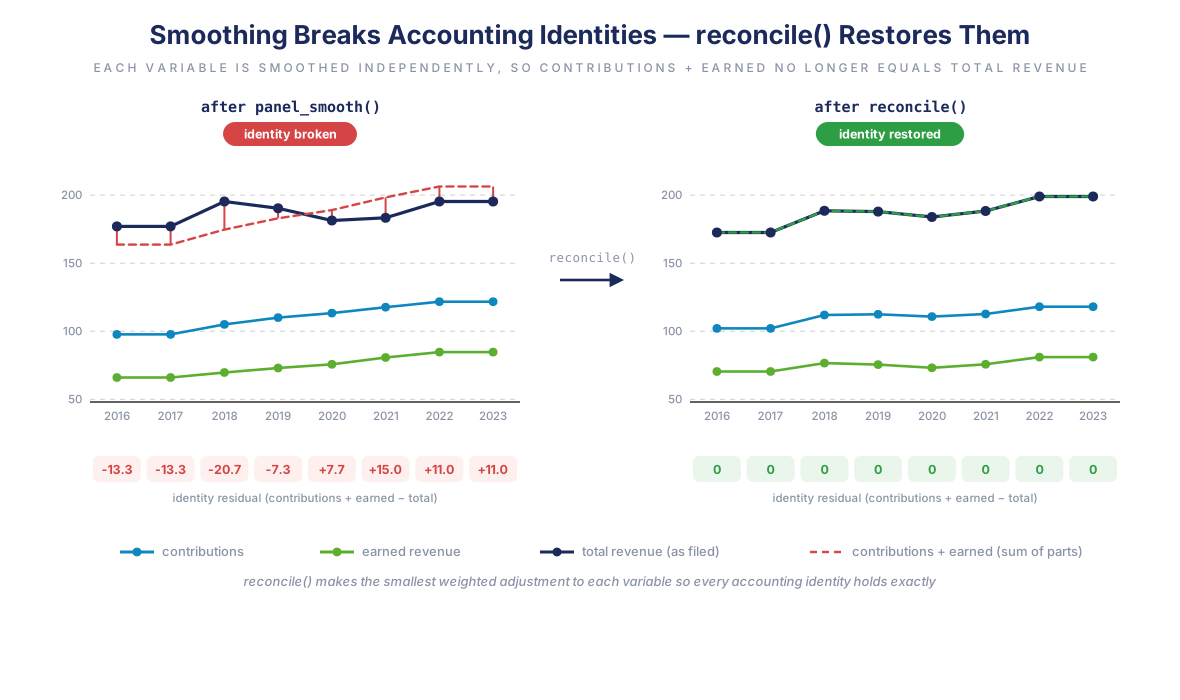
6. Reconcile accounting principles
990 financials carry deterministic identities — contributions
components sum to the contributions total, revenue lines sum to total
revenue, assets equal liabilities plus net assets. Cell-level cleaning
(partial imputation, rounding, smoothing over filer errors) can leave
rows that violate them. accounting_check() finds the
violations and reconcile() repairs them with the smallest
possible adjustment, holding the values you trust fixed:
row <- data.frame(
  EIN2 = "A", TAX_YEAR = 2020,
  F9_08_REV_CONTR_FED_CAMP = 100, F9_08_REV_CONTR_MEMBSHIP_DUE = 50,
  F9_08_REV_CONTR_FUNDR_EVNT = 30, F9_08_REV_CONTR_RLTD_ORG = 20,
  F9_08_REV_CONTR_GOVT_GRANT = 180,   # imputed; the org reported a 500 total
  F9_08_REV_CONTR_OTH = 90,           # imputed
  F9_08_REV_CONTR_TOT = 500
)
accounting_check(row)                 # contributions short by 30
#>   EIN2 TAX_YEAR                   identity residual    ok
#> 1    A     2020 rev_contributions_subtotal       30 FALSE

rec <- reconcile(row, fixed = setdiff(names(row), c("F9_08_REV_CONTR_GOVT_GRANT",
                                                    "F9_08_REV_CONTR_OTH")))
rec[, c("F9_08_REV_CONTR_GOVT_GRANT", "F9_08_REV_CONTR_OTH", "F9_08_REV_CONTR_TOT")]
#>   F9_08_REV_CONTR_GOVT_GRANT F9_08_REV_CONTR_OTH F9_08_REV_CONTR_TOT
#> 1                        195                 105                 500
accounting_check(rec)                 # identities restored
#> [1] EIN2     TAX_YEAR identity residual ok
#> <0 rows> (or 0-length row.names)
Where to next
Each step has a task-focused vignette with the full details:
- Downloading and assembling efile tables and the sampling framework — building panels reproducibly
- Cross-year requirements on the source — sampling on conditions that span years, resolved before the read
- Panels and panel slices — the classification vocabulary
- Imputing missing years, Completing panel spans, Smoothing panel variables, Balancing a panel — cleaning
- Accounting consistency and Consistent gap-filling — validation