panel_smooth() replaces a numeric field with a rolling
weighted average taken within each organization, ordered by
year. It dampens year-to-year noise (reporting quirks, one-off spikes)
while leaving the rows in place.
A single organization with a one-year spike:
df <- data.frame(
  EIN2     = "A",
  TAX_YEAR = 2016:2022,
  revenue  = c(10, 12, 11, 50, 13, 12, 11)   # spike in 2019
)
Window and weights
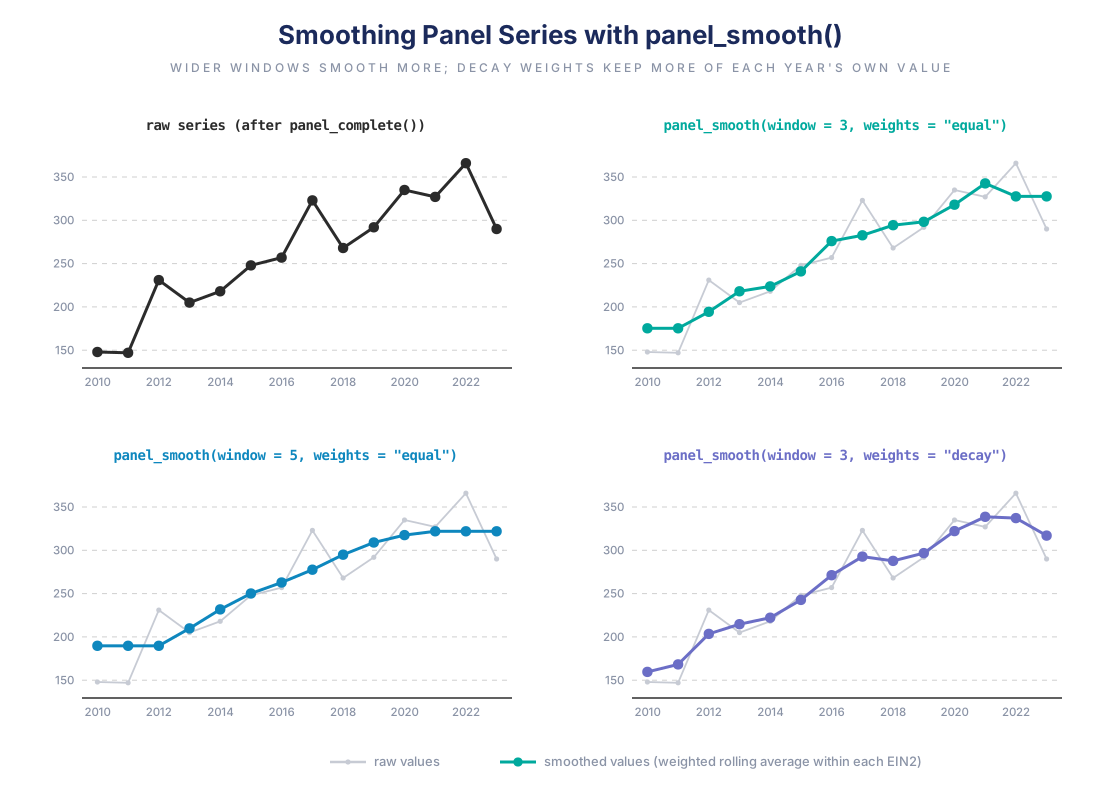
window is the (odd) number of years averaged;
weights decides how much each year in the window
counts:
-
equal– a plain moving average; every year in the window counts the same. -
half– the focal year gets half the weight, the neighbours share the other half. -
decay– weight falls by half per year of distance (0.5^distance).
w <- function(wt) panel_smooth(df, "revenue", window = 3, weights = wt,
                               verbose = FALSE)$revenue
data.frame(
  year    = df$TAX_YEAR,
  raw     = df$revenue,
  equal   = round(w("equal"), 1),
  half    = round(w("half"), 1),
  decay   = round(w("decay"), 1)
)
#>   year raw equal half decay
#> 1 2016  10  11.0 10.8  10.7
#> 2 2017  12  11.0 11.2  11.2
#> 3 2018  11  24.3 21.0  21.0
#> 4 2019  50  24.7 31.0  31.0
#> 5 2020  13  25.0 22.0  22.0
#> 6 2021  12  12.0 12.0  12.0
#> 7 2022  11  12.0 11.8  11.6
Notice 2019: equal pulls the spike down hardest (it
treats the neighbours and the spike alike), while half and
decay keep more of the focal value. (For a centred width-3
window half and decay give identical weights;
they differ at the series edges, where the window is off-centre, and
more visibly from window = 5 on, where decay
down-weights distant years more steeply.)
A wider window smooths more aggressively:
data.frame(
  year = df$TAX_YEAR,
  w3   = round(panel_smooth(df, "revenue", window = 3, verbose = FALSE)$revenue, 1),
  w5   = round(panel_smooth(df, "revenue", window = 5, verbose = FALSE)$revenue, 1)
)
#>   year   w3   w5
#> 1 2016 11.0 19.2
#> 2 2017 11.0 19.2
#> 3 2018 24.3 19.2
#> 4 2019 24.7 19.6
#> 5 2020 25.0 19.4
#> 6 2021 12.0 19.4
#> 7 2022 12.0 19.4
Edges, gaps, and multiple series
At the ends of a series the fixed-width window slides inward rather
than shrinking, and organizations with fewer years than
window use a smaller effective window. Missing values
(NA/NaN) are dropped from each window and the
remaining weights are renormalized, so a stray gap does not blank out
its neighbours; a window with nothing observed returns
NA.
panel_smooth() handles many organizations and several
fields at once, always smoothing each organization independently and
returning the rows in their original order:
panel <- data.frame(
  EIN2     = rep(c("A", "B"), each = 4),
  TAX_YEAR = rep(2019:2022, 2),
  revenue  = c(100, 300, 200, 400,  50, 40, 90, 60),
  expenses = c(90,  250, 180, 350,  45, 35, 80, 55)
)
head(panel_smooth(panel, vars = c("revenue", "expenses"),
                  window = 3, verbose = FALSE), 4)
#>   EIN2 TAX_YEAR revenue expenses
#> 1    A     2019     200 173.3333
#> 2    A     2020     200 173.3333
#> 3    A     2021     300 260.0000
#> 4    A     2022     300 260.0000
Smoothing changes values but never the shape of the data – same rows, same order, selected columns replaced by their smoothed versions.