Machine learning approaches to data analysis are often predictive models, not regression models or causal frameworks common in many social sciences. Model fit is assessed by predictive performance rather than statistical significance. We have included this information as a quick reference for those interested in understanding how to interpret output that is common to many supervised learning algorithms.
Model Fit
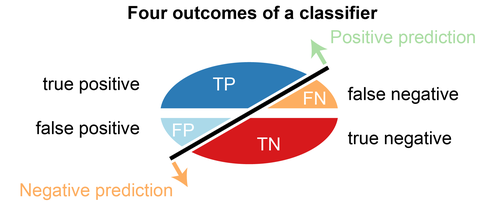
THE CONFUSION MATRIX
                              Predicted Group
Actual Group               YES                NO
         YES    TRUE Positives   FALSE Negatives
          NO   FALSE Positives    TRUE Negatives
The confusion matrix organizes the results into a table where the actual classes are represented by row values, and the predicted classes are represented by column values. It is a compact way to represent information regarding algorithm performance.
Common Metrics
Takaya Saito and Marc Rehmsmeier have developed a great website explaining some commmon fit metrics that we present here. LINK TO WEBSITE
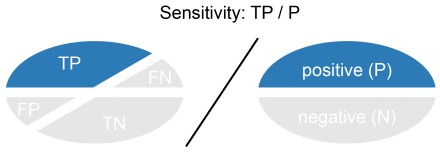
Sensitivity or Recall is the number of True Positives divided by the number of True Positives and the number of False Negatives. Put another way it is the number of positive predictions divided by the number of positive class values in the test data. It is also called the True Positive Rate. Sensitivity can be thought of as a measure of a classifiers completeness. A low recall indicates many False Negatives.
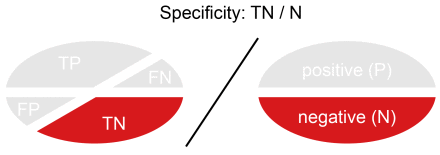
Specificity (SP) is calculated as the number of correct negative predictions divided by the total number of negatives. It is also called True Negative Rate (TNR).
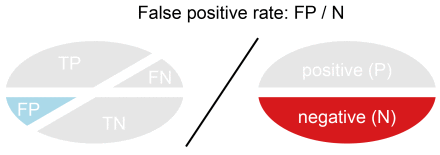
False Positive Rate (FPR) is calculated as the number of incorrect positive predictions divided by the total number of negatives. The best false positive rate is 0.0 whereas the worst is 1.0.
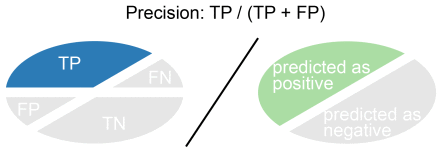
Precision is True Positives divided by the number of True Positives and False Positives. Put another way, it is the number of positive predictions divided by the total number of positive class values predicted.
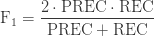
The F1 Score is the 2 * (precision*recall) / (precision+recall) . It is also called the F Score or the F Measure. Put another way, the F1 score conveys the balance between the precision and the recall. cite
| METRIC |
FORMULA |
| Sensitivity (true positive rate) |
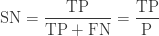 |
| Specificity (true negative rate) |
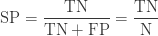 |
| Precision |
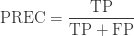 |
| Recall |
|
| F1 |
 |
| Accuracy |
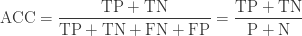 |
| Error |
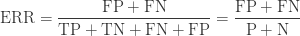 |
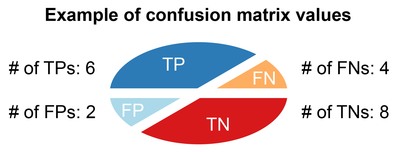
Example
Here are results from an exercise with a dataset with 20 values to demonstrate the calculation of some of the metrics cite:
                 PREDICTED
OBSERVED
            Positive  Negative
Positive        6        4
Negative        2        8
| METRIC |
ABBR |
CALCULATIONS |
| Error rate |
ERR |
6 / 20 = 0.3 |
| Accuracy |
ACC |
14 / 20 = 0.7 |
| Sensitivity |
SN |
6 / 10 = 0.6 |
| True positive rate |
TPR |
6 / 10 = 0.6 |
| Recall |
REC |
6 / 10 = 0.6 |
| Specificity |
SP |
8 / 10 = 0.8 |
| True negative rate |
TNR |
8 / 10 = 0.8 |
| Precision |
PREC |
6 / 8 =0.75 |
| Positive predictive value |
PPV |
6 / 8 =0.75 |
| False positive rate |
FPR |
2 / 10 = 0.2 |
Sample R Output
## Confusion Matrix and Statistics
##
##                 predicted_class
## actual_class       0       1
##            0   0.827   0.041
##            1   0.059   0.071
##
## Sensitivity : 0.933
## Specificity : 0.630
## Pos Pred Value : 0.952
## Neg Pred Value : 0.545
## Precision : 0.952
## Recall : 0.933
## F1 : 0.942
## Prevalence : 0.887
## Detection Rate : 0.827
## Detection Prevalence : 0.869
## Balanced Accuracy : 0.781