The governance package turns raw IRS Form 990 governance and management fields into a multi-dimensional governance index for benchmarking nonprofits. The workflow is two steps: normalize the raw fields into a binary feature matrix with get_features(), then score them against a pre-fit factor model with get_scores().
Step 1: Get input data
get_features() expects a data frame of raw 990 efile fields — the governance, management, and disclosure questions from Part IV, Part VI, Part XII, and Schedule M. The companion panel990 package retrieves and assembles them; get_governance_data(years = 2022) returns a data frame ready for the steps below. See vignette("download-data") for the fields, the required tables, and the full-990 filter.
The package also ships a ready-to-use example — a 5,000-organization sample of raw 2022 fields — so you can try the workflow without downloading anything.
Step 2: Build the feature matrix
get_features() normalizes the raw fields (yes/no, "X" flags, member counts) into 12 binary governance features, appended to the input.
features_example <- get_features(dat_example)

features_example |>
  select(ORG_EIN, P6_LINE_1, P6_LINE_12_13_14, P12_LINE_1) |>
  head()
#>        ORG_EIN P6_LINE_1 P6_LINE_12_13_14 P12_LINE_1
#> 849  521314461         1                1          1
#> 2532 832563658         1                0          1
#> 2699 870470748         0                1          1
#> 2478 752538361         1                0          0
#> 531  650144766         1                0          1
#> 3673 883636365         0                0          0
Step 3: Calculate the scores
get_scores() applies the pre-fit factor model and appends six factor scores plus a total.score.
scores_example <- get_scores(features_example)

scores_example |>
  select(ORG_EIN, total.score) |>
  head()
#>        ORG_EIN total.score
#> 849  521314461  1.84480679
#> 2532 832563658  1.41783202
#> 2699 870470748 -0.08681385
#> 2478 752538361 -0.27424699
#> 531  650144766  0.60652413
#> 3673 883636365 -5.00061728
hist(scores_example$total.score,
     main = "Distribution of Governance Scores",
     xlab = "Total Score")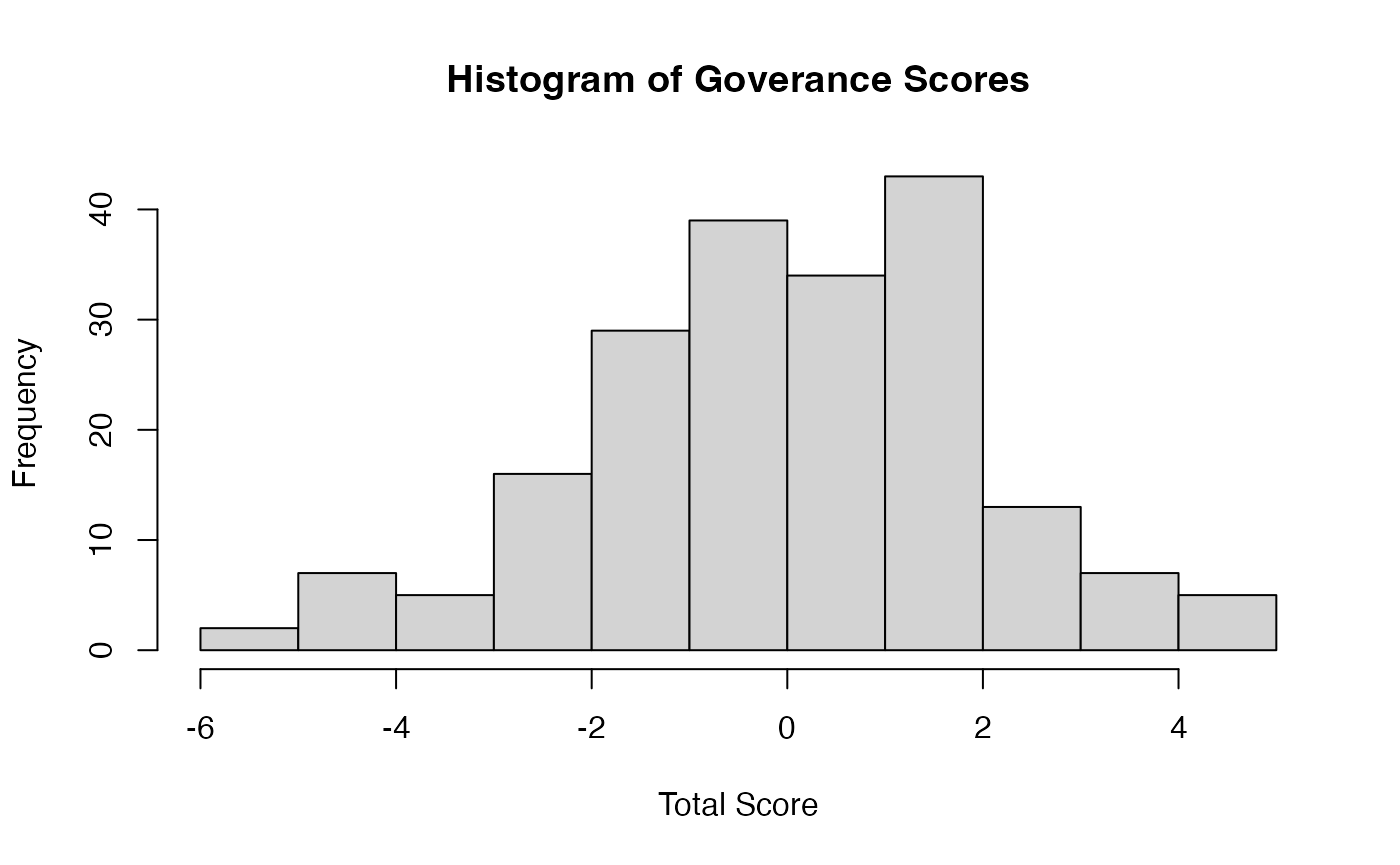
See vignette("governance-workflow") for a fuller walk-through and vignette("making-gov-scores") for the methodology behind the index.